How can I check my false-positive rate and is it right?
It is often thought that a false-positive rate (FPR) of 5% is somehow 'correct', because a 5% FPR is commonly used in the literature as a standard when comparing the performance of different screening tests. However, the correct FPR for your population will not necessarily be the same as the published estimates. It will depend on a number of factors, including the age distribution, which may differ from the age distribution of the standard populations used in scientific papers.
When assessing whether the FPR you observe in your screening programme is correct, that is, the one that would be expected for the population you screen, it is important to take into account the following factors which influence the FPR:-
- the age distribution of the screened population
- the combination of screening markers used
- whether an ultrasound scan is routinely used to date pregnancies
- whether MoM values are corrected for maternal weight
- the risk cut-off used
Determining the false-positive rate itself is not always possible, since it requires knowledge of the outcome of all pregnancies. However, affected pregnancies are relatively rare, and the screen-positive rate is, for practical purposes, a good approximation of the false-positive rate.
To examine the screen-positive rate, use Report Summary in the Statistics screen. Enter the time period required, and specify any doctor or address codes. A table similar to the following is shown. The screen-positive rate for Down's syndrome is the percentage with increased risk of Down's, while for neural tube defects (NTD) it is the percentage with raised AFP.
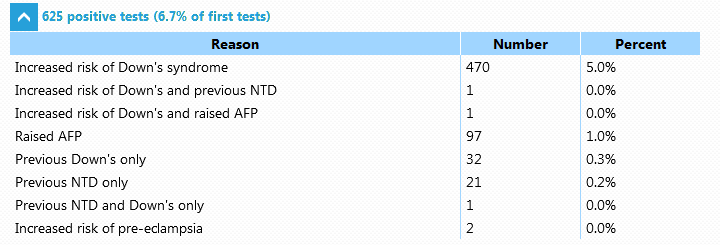
The screen positive rate (5.0% in this case) can then be compared to the expected false positive rate for your screened population.
Using the Population and Screening performance facilities from the Statistics screen, the population characteristics can be checked and a table created showing the expected screening performance for the population screened, using different combinations of markers. For example, a centre using the integrated test might see a table like the following:-
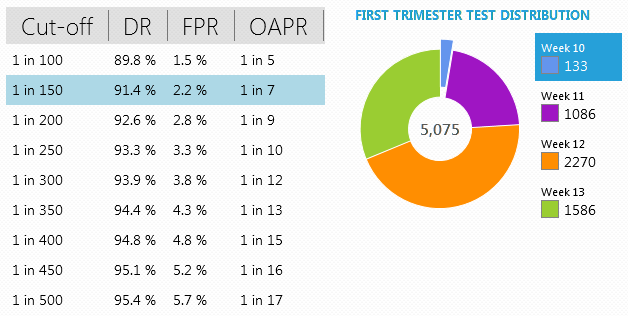
In this example, where the risk cut-off is 1 in 150, and ultrasound dating and weight correction are used in most cases, the expected screening performance is given at the intersection of the row and column indicated in the table above. The expected performance is expressed in terms of the Detection Rate (DR), the False Positive Rate (FPR), and the Odds of being Affected given a Positive Result (OAPR).