Sonographer specific NT medians
Since 2000, αlpha has included NT features which have proved to be important and useful. Alpha was the first screening software to introduce monitoring NT performance based on median MoM's, standard deviations and slope of NT in line with increasing gestational age. These features help the user quantify and monitor NT measurements for individual sonographers and, where appropriate, allow for systematic measurement differences between sonographers. The SURUSS study (Reference 1) showed that there was about a 5 percentage point increase in detection rate when sonographer specific medians were used compared to centre specific medians. αlpha also provides the option of using sonographer-specific medians or centre specific medians
1. αlpha records the identity of the sonographer
αlpha allows the user to record the identity of the sonographer for each NT measurement on the data entry screen together with the other information required for the screening test on a patient.
The figure below shows how a sonographer is specified in the data entry screen.

If the identified sonographer does not yet have NT median values assigned the centre specific sonographer medians will be used. This may arise if the sonographer has not yet taken enough NT measurements to establish normal medians. When the sonographer has taken enough NT measurements, normal medians can be established using the tabulation and regression features in αlpha (see below).
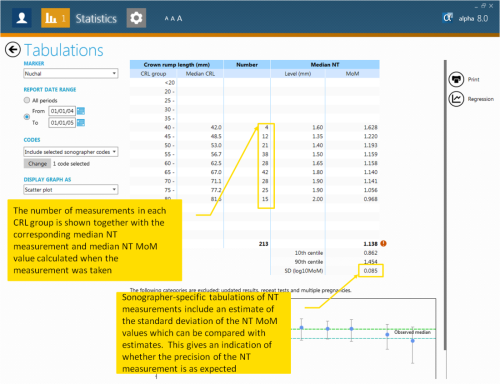
2. Sonographer-specific tabulations of NT measurements can be made
Sonographer-specific tabulations of NT measurements include an estimate of the standard deviation of NT MoM values which can be compared with published estimates. This gives an indication of whether the precision of NT measurement is as expected. The tabulation also includes the median NT measurements and NT MoM in each CRL group, the overall median MoM value and the tenth and ninetieth centile. The median MoM should generally lie between in the 95% confidence interval around 1.0 MoM. The NT standard deviation (in log10 MoM) will be less than 0.18 and the NT slope will be between 15% and 25% increase per week.
The figure below shows an example of a sonographer specific tabulation.
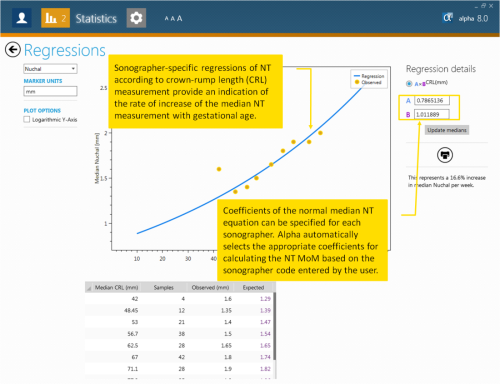
3. Coefficients of the normal median NT equation can be derived from sonographer-specific regressions
Sonographer-specific regressions of NT according to crown rump length (CRL) measurement provide an indication of the rate of increase of the median NT with gestational age. Coefficients of the normal median NT equation can be specified for each sonographer. αlpha automatically selects the appropriate coefficients for calculating the NT MoM, based on the sonographer code entered by the user. The observed NT measurements can be fitted to either a log-linear or sigmoid equation
The figure below shows an example of a sonographer specific regression.
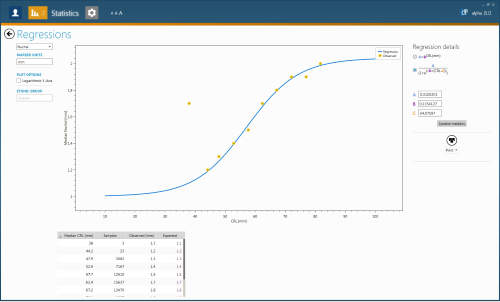
The figure below shows an example of NT measurements fitted to a sigmoid equation.
4. Monitoring NT medians
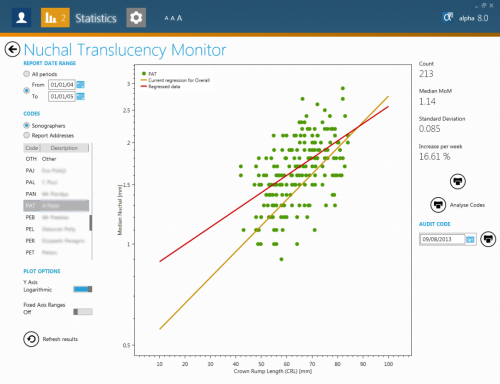
αlpha includes a facility which provides quick and easy monitoring of sonographer or site specific nuchal translucency medians. A user can select the sonographer’s name from a list and are immediately shown on the computer screen a chart of their NT/CRL measurements together with the number of scans performed, percentage increase of NT per week and standard deviation. A table can also be printed showing for all sonographers the number of scans performed, percentage increase of NT per week and standard deviation. This will be useful for users who need to regularly monitor NT medians for a large group of sonographers.
The figure below shows the Nuchal Translucency Monitor screen. The green circles are the individual measurements for the selected sonographer (PAT), the red line the regression of NT against CRL for this data and the brown line the current expected NT measurements for this sonographer. The screen additionally shows the number of measurements, median NT MoM, standard deviation and percentage increase per week for the selected sonographer.
References
First and second trimester antenatal screening for Down’s syndrome: the results of the Serum, Urine and Ultrasound Screening Study (SURUSS) (2003)
The estimation of median nuchal translucency values between 10 and 14 weeks of pregnancy (2014)