How to check that my normal median values are accurate
αlpha provides a broad range of quality control and monitoring features, to help you determine the performance expected from your screening programme, and ensure that the expected screening performance is achieved. For more details on the different monitoring features click here.
An important routine monitoring task is examining the normal median values of the screening markers, so that any drift can be identified and corrected. The Median Analysis feature in αlpha displays the median reported MoM values in different periods.
The figure shows the median MS-AFP MoM values plotted by month. The MoM is fairly close to 1.0
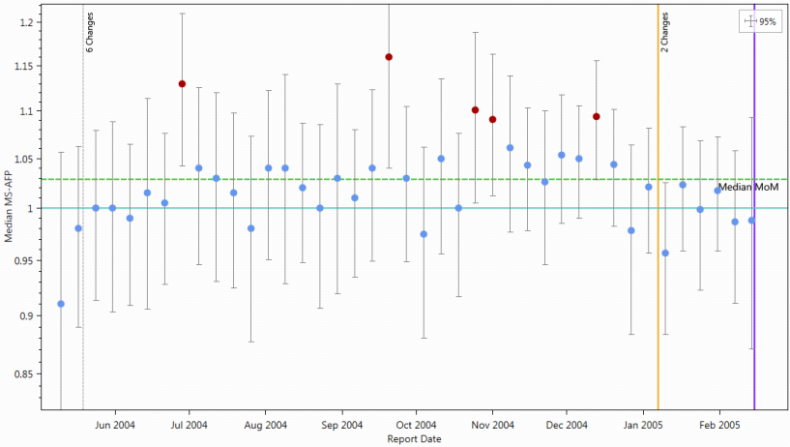
If the median MoM is consistently above or below 1.0 MoM, this may be an indication that the normal median equation does not accurately estimate the median concentration of the screening marker, and needs updating.
The Tabulation facility, in the Statistics screen, allows you to tabulate screening markers by gestational week over a specified time period, and get a new regression equation for the tabulated data. The coefficients of the new regression are calculated automatically.
LMS offers an alphaCheck service free of charge to licensed αlpha users. We will guide you through the steps involved in monitoring screening performance, and provide expert advice in correcting any problems identified. Please contact us if you would like an alphaCheck.